Sight Distance:
Sight distance is the length of road visual a head to the driver at any distance. ( it is considered by taking the height of eyes of the driver to be 1.2 m and height of object to be 0.15 m).
Note: This topic is part of the second chapter of Highway Engineering. I suggest reading this topic in the context of the complete chapter: Geometric Design of Highway. If you want to read the entire Highway Engineering, click here: Highway Engineering.
Restriction to the visibility/sight distance maybe caused in the following cases:
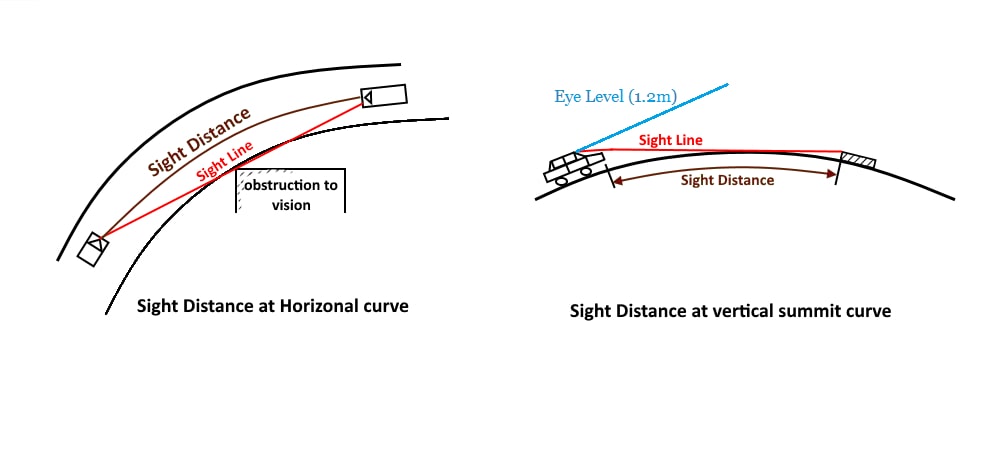
- At horizontal curve, when the line of sight is obstructed by the object and the inner side of the curve.
- At a vertical curve the line of sight age of obstructed by the road surface of the curve.
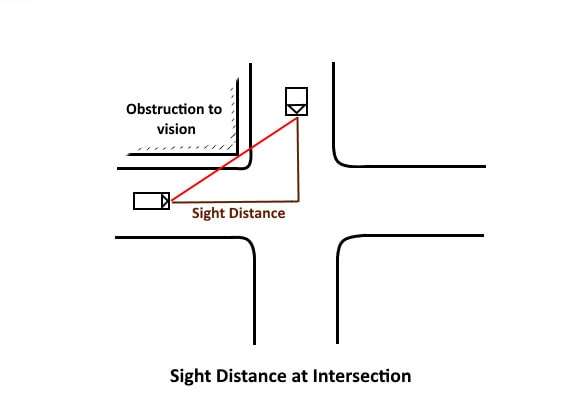
- At an uncontrolled intersection when a driver from one of the approach road is able to sight a vehicle from another approach road towards it at the intersection, due to the presence of obstruction.
The sight distance available to the driver is depend upon following factor:
- Feature of road ahead: Horizontal curve, vertical profile, traffic condition, position of obstruction.
- Height of driver eyes above the road surface.
- Height of object above the road surface.
Sight distance on a highway depends upon the following factors:
- Total Reaction Time of Driver
- Design speed
- Braking Efficiency
- Frictional Resistance Between Road and Tyres
- Gradient of Road
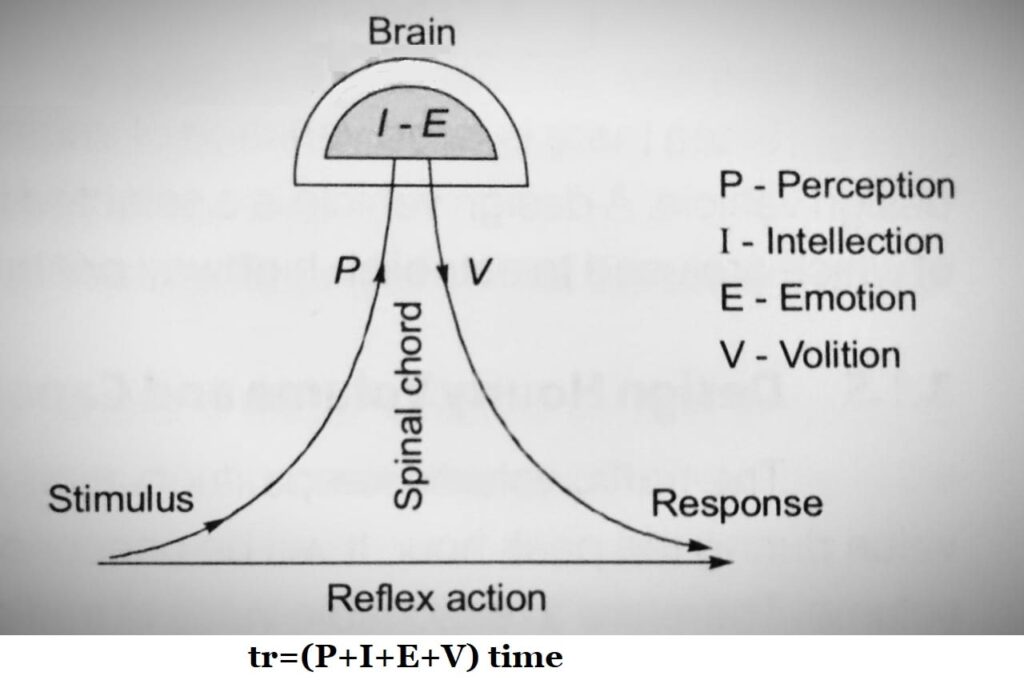
1.Total Reaction Time of Driver
- It is the time taken from the instant the object is visible to the driver to the instant brakes and apply effectively.
- The total reaction time is further divided into different components and can be explained as follows:
- Perception(P): The time required for the sensation received by the eyes or ears of a driver to be transmitted to the brain through the nervous system and spinal cord.
- Intellection Time (I): it is the time required to the driver to understand the situation. It is also the time required for comparing different thoughts, regrouping & registering new sensation.
- Emotion Time (E): It is the time elapsed during emotional sensations and other mental disturbances such as fear, anger, superstition etc with the situation to come into play.This time varies from person to person and even for the same person in different situations .
- Volition Time (V): It is the time taken by a driver, for final action, like application of brakes.
- The above can be termed as “PIEV” analysis for Total Reactions Time.
Note:
- It is also possible that the driver may apply brakes or take any other avoiding action, like turning, by the reflex action, without normal thinking process, that is observed to be min time for avoiding the collision.
- This reaction time depend on several factor like driver skill, type of obstruction involved, environmental condition, age, etc
- Total reaction time is measured on the basis of PIEV theory which varies from 0.5 second for simple situations to 3-4 second for complex situations.
Remember:
- IRC recommended, reaction time of 2.5 second for stopping sight distance and 2.0 seconds for overtaking sight distance calculations.
2.Design speed:
- During the total reaction time of the driver the distance moved by the vehicle is depend upon design speed.
- If speed of vehicle is not mentioned in the problem then consider the design speed of the highway as the speed of vehicle.
- Braking distance means distance traveled by vehicle before coming to a stop/half also depends on design speed.
3.Braking Efficiency:
- Efficiency of brakes depends upon the age and characteristics of the vehicle. If we say the brakes are 100% efficient, it means the vehicle will stop at the moment of application of brakes. But practically 100% efficiency update is not achieved, otherwise skidding will occur which is uncontrollable and dangerous for the vehicle and road users.
- For the design purpose of the highway, we considered 50% brake efficiency of the vehicle.
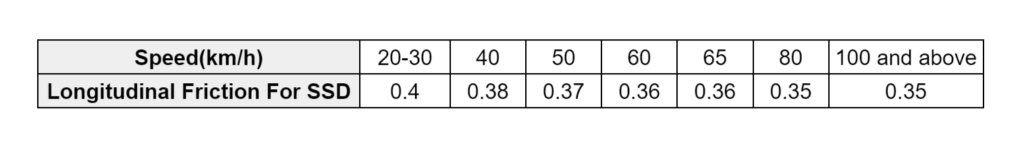
4.Frictional Resistance Between Road and Tyres:
- The frictional resistance developed between the road and tyres depends on the coefficient of friction.
- Higher is coefficient of friction, higher is the frictional resistance and lower is SSD.
- Coefficient of friction further depends upon the condition of tyres and Road.
- It is further linked with the design speed of vehicle as follows:
5.Gradient of Road (If Any):
- When we are going down on a gradient, gravitational force also come into action which causes the vehicle to take more time to stop the vehicle means more sight distance is required. While in climbing up a gradient less sight distance is required because the time taken to stop the vehicle will be less.
Sight distance are of following types:
Stopping sight distance (SSD).
Safe overtaking distance (OSD).
Intermediate sight distance (ISD)
Safe sight distance for entering into uncontrolled intersection.
Headlight sight distance.