Consistency Atterberg Limits
- Liquid Limit (WL)
- Plastic Limit (Wp)
- Shrinkage Limit (Ws)
Liquid Limits (WL)
- It is defined as the minimum water content at which soil has a tendency to flow.
- At the liquid limit, soil passes liquid state of consistency to a plastic state of consistency & visa-versa.
- At the liquid limit, all the solids pass same negligible shear strength of 2.7 Kn/m², which can be just saturated. ( At liquid limit shear strength is the same of all soil).
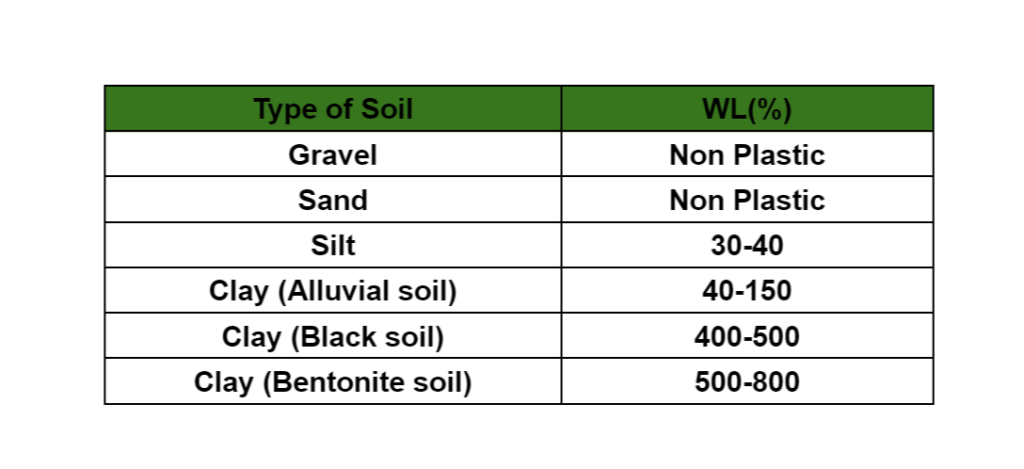
Note: Higher is the Liquid Limit of the soil Higher is its compressibility (volume change).
WL ⇑ (SOIL) = Compresibility ( Volume Change) ⇑ .
⇒From a determination point of view liquid limit (WL) may also be defined as min water content at which a part of soil cut by a groove of standard size flow together by the distance of .5 inch (12mm) under the impact of 25 number of blows, where the height of fall is adjusted to 1cm for each blow.
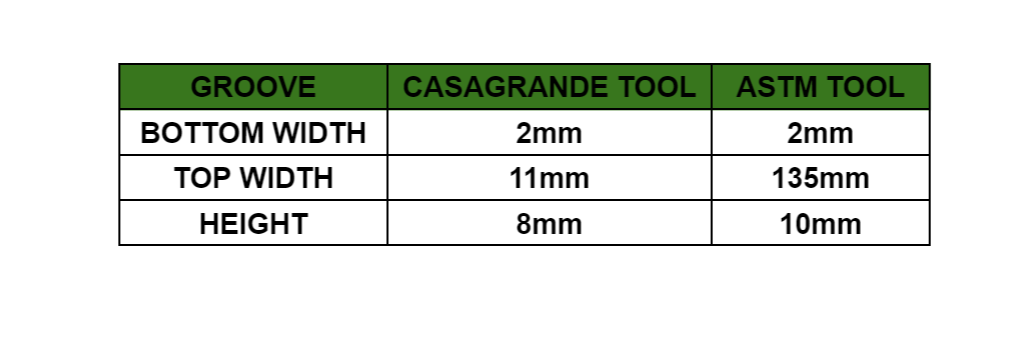
⇒The tool used for cutting the soil may be CASAGRANDE TOOL OR ASTM TOOL.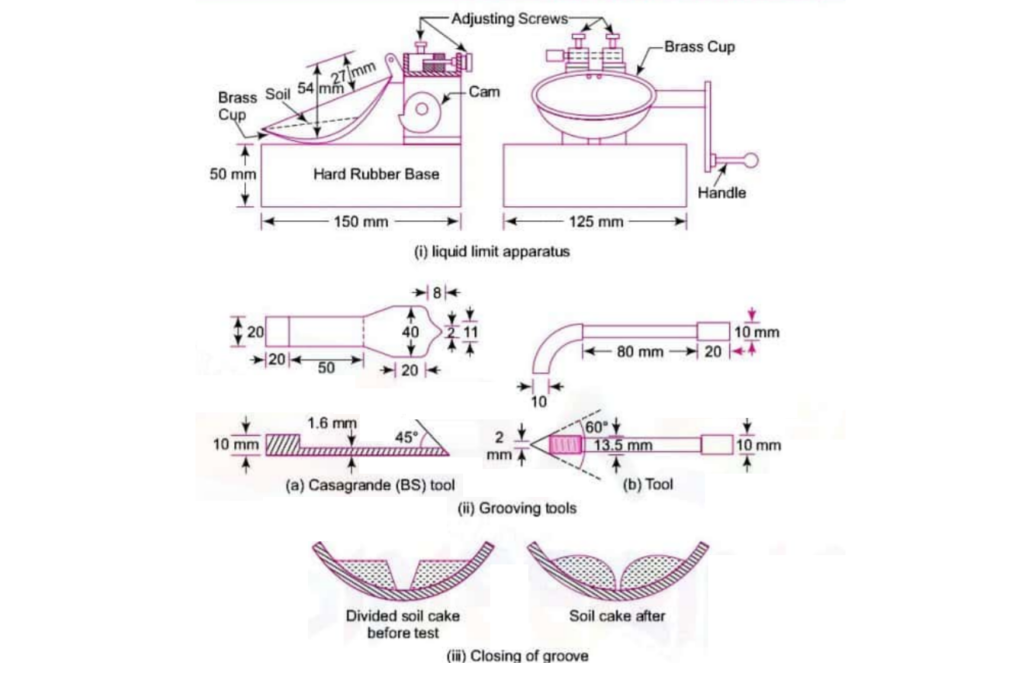
Test To Find Liquid Limit (Casagrande Test)
- 120 Gm of soil (Dry soil) passing through 425μ sieve is mixed with sufficient water so as to form a uniform paste from it.
- A portion of soil is placed in the cup & a groove of standard size it made it.
- The handle is rotated at the rate about 2 revolution per second & no of blows required to flow the soil by distance of 0.5 inch is noted.
- About 10 Gm of soil form near the closed groove is taken for determination of water content( using any method – oven dry method).
- Test is repeated at different water content & corresponding no of blows to flow the soil by distance of 0.5 inch is noted.
- The result of test is plotted in the form of curve termed as “FLOW CURVE” & water content corresponding to 25 number of blows to blows to flow the soil by distance of 0.5 inch is interpolated & termed as liquid limit.
NOTE:- In some cases soil slips in stead of flowing in the test, the result of such test is discarded. (HINDI -Flow hona chahiye / slip nhi hona chahiye)
- In flow curve water contend is marked on Y- axis & corresponding no of blows is marked on X- axis on log scale.
- Test is repeated such that no of blows range from 20-50.
Remark:
1. ASTM is suitable for more sandy soil where CASAGRANDE tools tend to tear the sides of the groove.
2. The slope flow curve is termed as “Flow Index” (IF) which signifies the rate loss of shear strength of soil with an increase in water content. ( For better understanding – When water content increases number of blows to flow the soil by a distance of 0.5 inches is decrease & no of blows are directly propositional to shear strength so shear strength decreases with increasing water content. )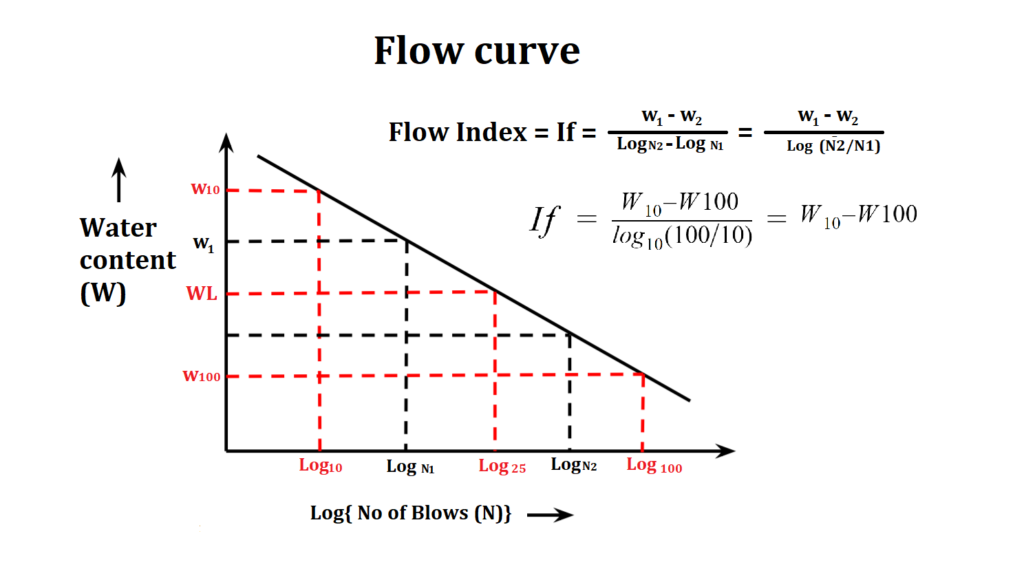
3. Higher is the value of FLOW INDEX (If), lower is the shear strength of soil.
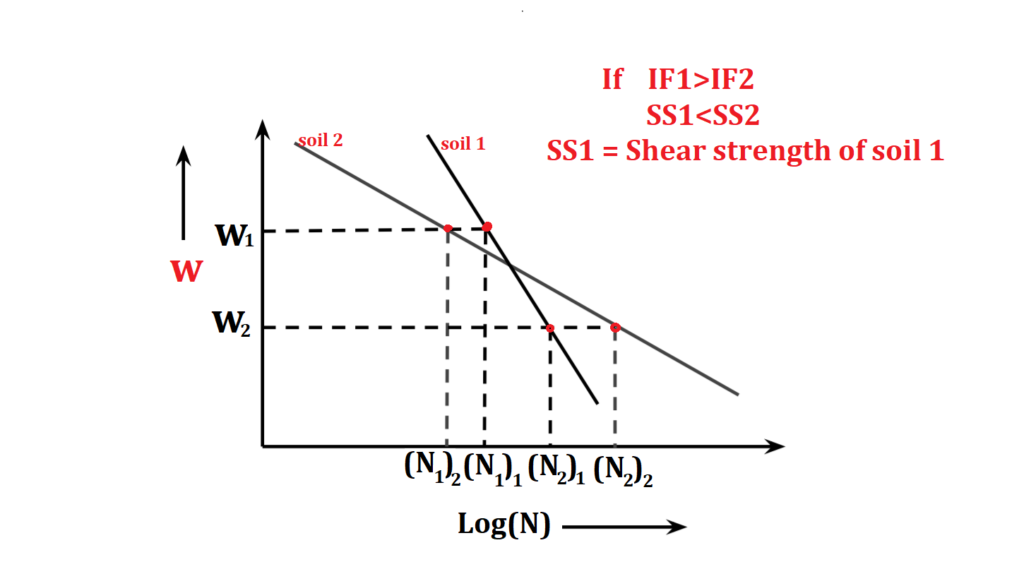 Slope of soil 1 > Slope of soil 2 So IF1>IF2
For Soil 1
- When water content decreases w1 to w2 of soil 1, the number of blows to flow the soil by a distance of 0.5 inches required ΔN1. (ΔN1=(N2)1-(N1)1
For Soil 2
- When water content decreases from w1 to w2 of soil 2, the number of blows to flow the soil by a distance of 0.5 inches required ΔN2. (ΔN2=(N2)2-(N1)2
ΔN2>ΔN1 (no of a blow for soil 2 > soil 1)
No of blow is directly propositional to shear strength. so SHEAR STRENGTH OF SOIL 1 IS LESS THAN SHEAR STRENGTH OF SOIL 2.
4. During the analysis curve is interpolated to find water content corresponding to 10 & 100 no of blows, different of water content directly gives FLOW INDEX (If).
(IF⇑=SHEAR STRENGTH ⇓)
5. If we change soft rubber base to hard rubber or steel base then water content and flow index are change. 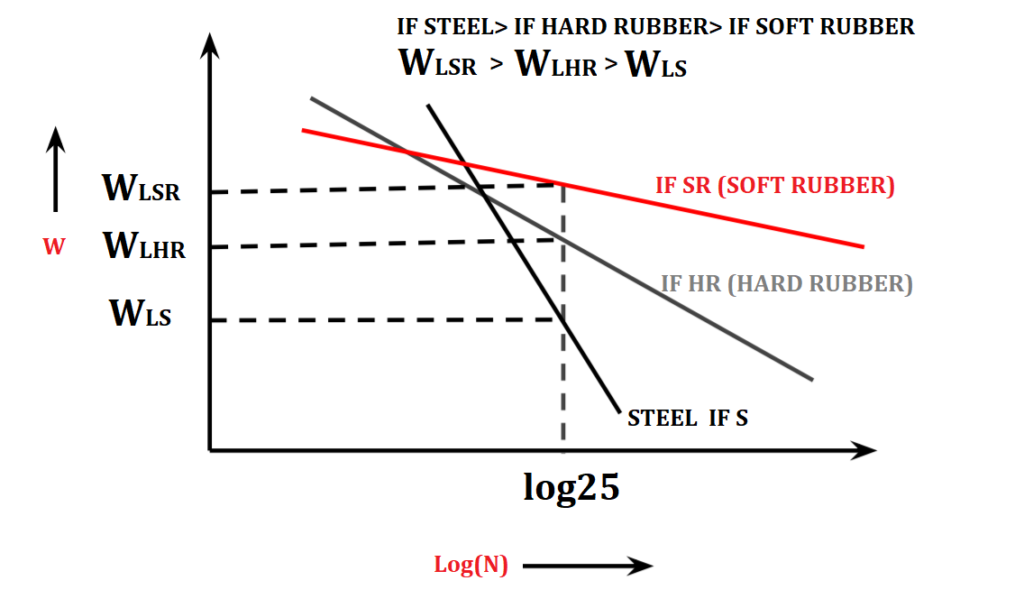
Liquid Limit of soil can also be found by:
1. One Point Method
As time required in the previous method was comparatively more as follows
\(W_{L}=W_{n}\left ( \frac{N}{25} \right )^{^{x}}\)x= 0.068 – 0.121 ( By MOHAN )
If N = 20-30, x=0.1
Wn = water content corresponding to N number of blows required to flow the soil by 0.5-inch distance.
2. Is Code Method (Is-2720)
\(W_{L}=\frac{W_N}{1.3213-0.23log_{10}N}\)(N=15-35)
3. Static Cone Penetration Test
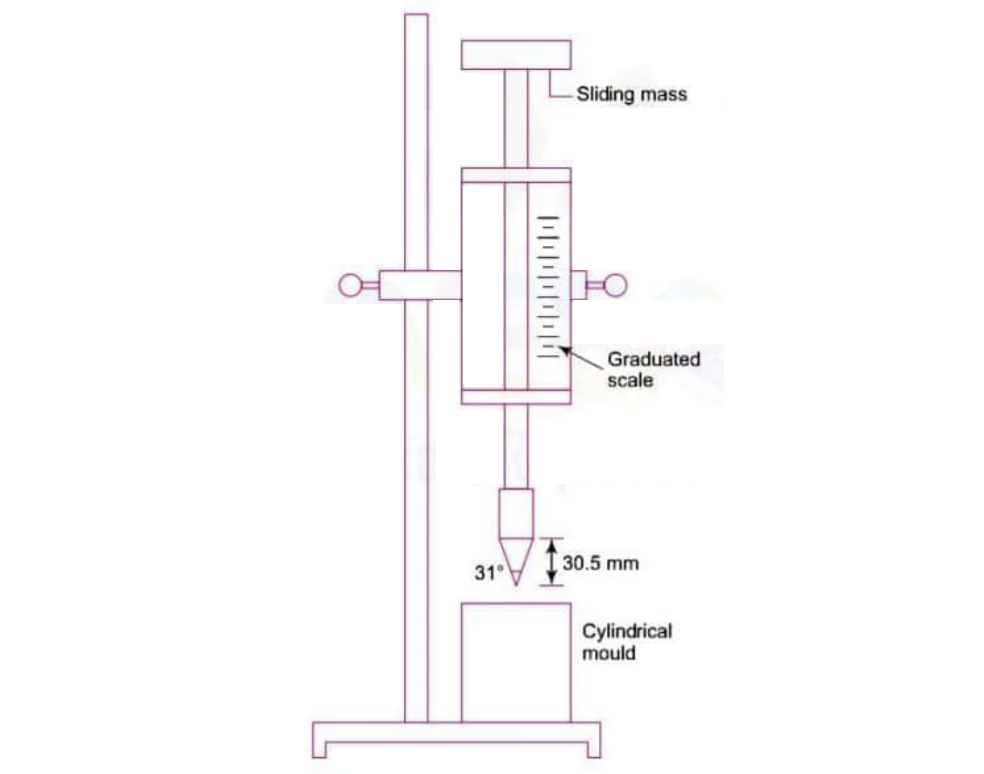
- It consists of a static cone penetrometer having a central cone angle of 31º & sliding mass of 80 gm.
- The sample to be tested is filled in cylindrical containers of diameter & height of 5cm each.
- The cone is lowered up to the top surface of the sample & released.
- Liquid Limit is taken as that water content that allows the penetration of cone into the sample by 20mm.
NOTE: Here also Liquid limit can be found by one point method as
\(W_{L}=\frac{W_x}{0.77log_{10}x}\)Where “x” is the penetration of cone in (mm) into the sample at a water content of “w”.
| Subject | Soil Mechanics |
| Unit | Soil Formation & Properties of Soil |
| Topic | Liquid Limits- Consistency Atterberg Limits |
| Next Topic | Plastic Limits- Consistency Atterberg Limits |
| Previous Topic | Consistency of Soil |